pacman::p_load(sf, tmap, tidyverse)Geospatial Point Data
Loading packages and importing dataset
sgpools <- read_csv("aspatial/SGPools_svy21.csv")
list(sgpools)
[[1]]
# A tibble: 306 × 7
NAME ADDRESS POSTC…¹ XCOORD YCOORD OUTLE…² Gp1Gp…³
<chr> <chr> <dbl> <dbl> <dbl> <chr> <dbl>
1 Livewire (Marina Bay Sands) 2 Bayf… 18972 30842. 29599. Branch 5
2 Livewire (Resorts World Sentos… 26 Sen… 98138 26704. 26526. Branch 11
3 SportsBuzz (Kranji) Lotus … 738078 20118. 44888. Branch 0
4 SportsBuzz (PoMo) 1 Sele… 188306 29777. 31382. Branch 44
5 Prime Serangoon North Blk 54… 552542 32239. 39519. Branch 0
6 Singapore Pools Woodlands Cent… 1A Woo… 731001 21012. 46987. Branch 3
7 Singapore Pools 64 Circuit Rd … Blk 64… 370064 33990. 34356. Branch 17
8 Singapore Pools 88 Circuit Rd … Blk 88… 370088 33847. 33976. Branch 16
9 Singapore Pools Anchorvale Rd … Blk 30… 540308 33910. 41275. Branch 21
10 Singapore Pools Ang Mo Kio N2 … Blk 20… 560202 29246. 38943. Branch 25
# … with 296 more rows, and abbreviated variable names ¹POSTCODE,
# ²`OUTLET TYPE`, ³`Gp1Gp2 Winnings`Creating an sf data frame from an aspatial data frame
According to Wikipedia, Simple Features (officially Simple Feature Access) is a set of standards that specify a common storage and access model of geographic feature made of mostly two-dimensional geometries (point, line, polygon, multi-point, multi-line, etc.) used by geographic information systems. It is formalized by both the Open Geospatial Consortium (OGC) and the International Organization for Standardization (ISO).
Note that geographic coordinate systems are not suitable if distances and areas need to be accurate. This is because a degree difference increases in distance the closer the degree is to the equator. Hence projected coordinates are preferred. Projection system coordinates tend to be based on distance (e.g. metres, as in the case for Singapore), rather than degrees of latitude.
Convert sgpools into a simple feature data frame. A new column called geometry will be added, which has the coordinates in the specified European Petroleum Survey (EPSG) format.
sgpools_sf <- st_as_sf(sgpools,
                       coords = c("XCOORD", "YCOORD"),
                       crs= 3414)
(Note: The crs argument requires the coordinates system in epsg format.)
Drawing Proportional Symbols
Set tmap mode to interactive viewing:
Map:
tmap_mode("view")
tm_shape(sgpools_sf)+
tm_bubbles(col = "tomato",
           size = 1,
           border.col = "black",
border.lwd = 1)tmap_mode("plot")
Make it proportional:
tmap_mode("view")
tm_shape(sgpools_sf)+
tm_bubbles(
  col = "royalblue3",
           size = "Gp1Gp2 Winnings",
           border.col = "azure",
border.lwd = 1)tmap_mode("plot")
Fill bubble colours by group and create facet plots:
tm_shape(sgpools_sf) +
  tm_bubbles(col = "OUTLET TYPE",
          size = "Gp1Gp2 Winnings",
          border.col = "black",
          border.lwd = 1) +
  tm_facets(by= "OUTLET TYPE",
            nrow = 1,
            sync = TRUE)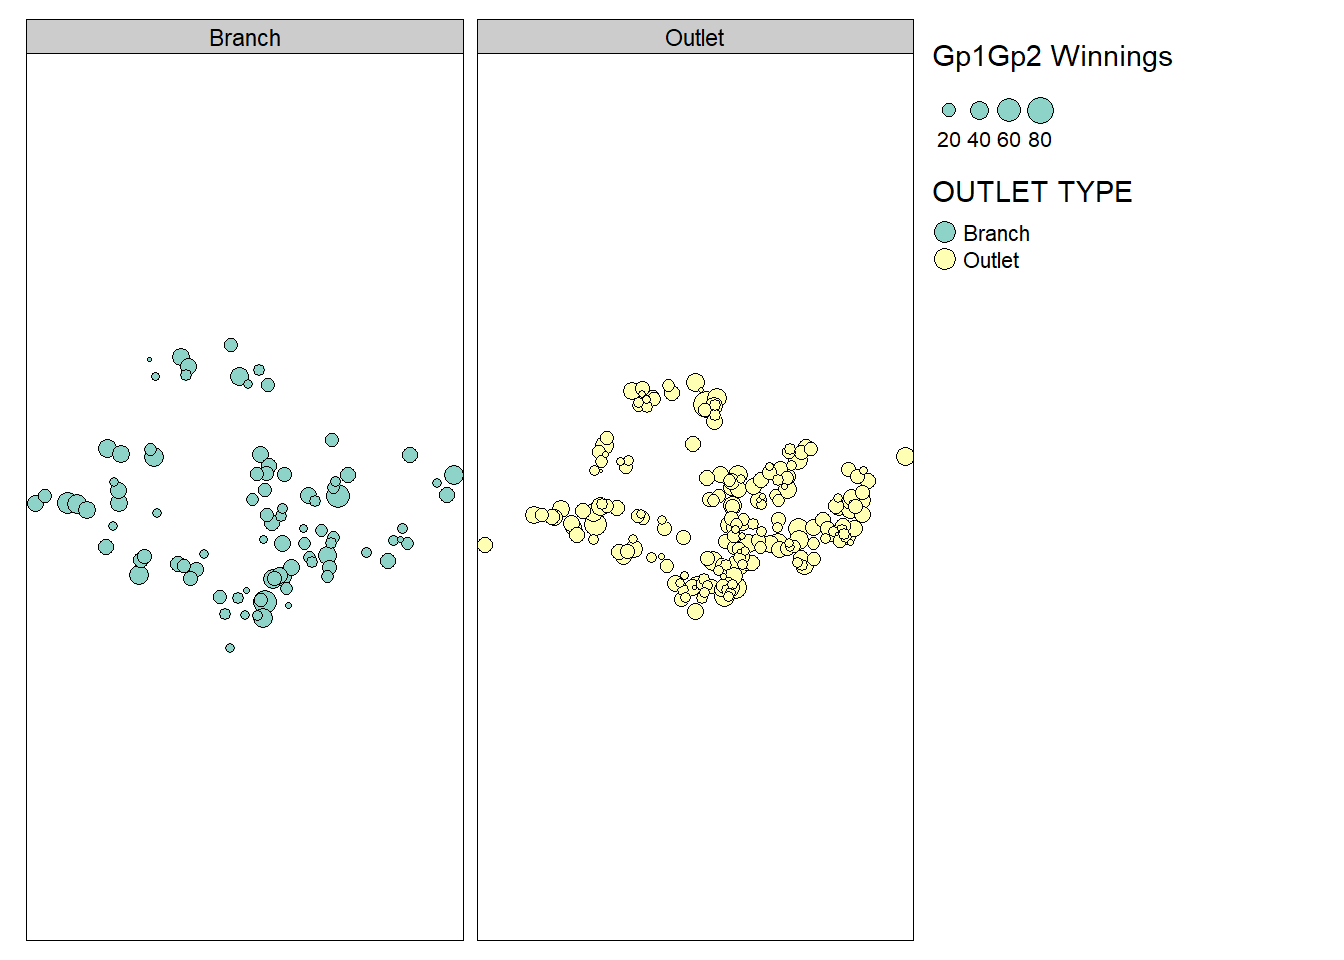
Remember
to switch tmap viewer back to “plot” (static) mode at the end of each session!
tmap_mode("plot")