pacman::p_load(corrplot, tidyverse, ggstatsplot)Correlation Matrices
wine <- read_csv("data/wine_quality.csv")
pop_data <- read_csv("data/respopagsex2000to2018_tidy.csv")
Correlation Matrices
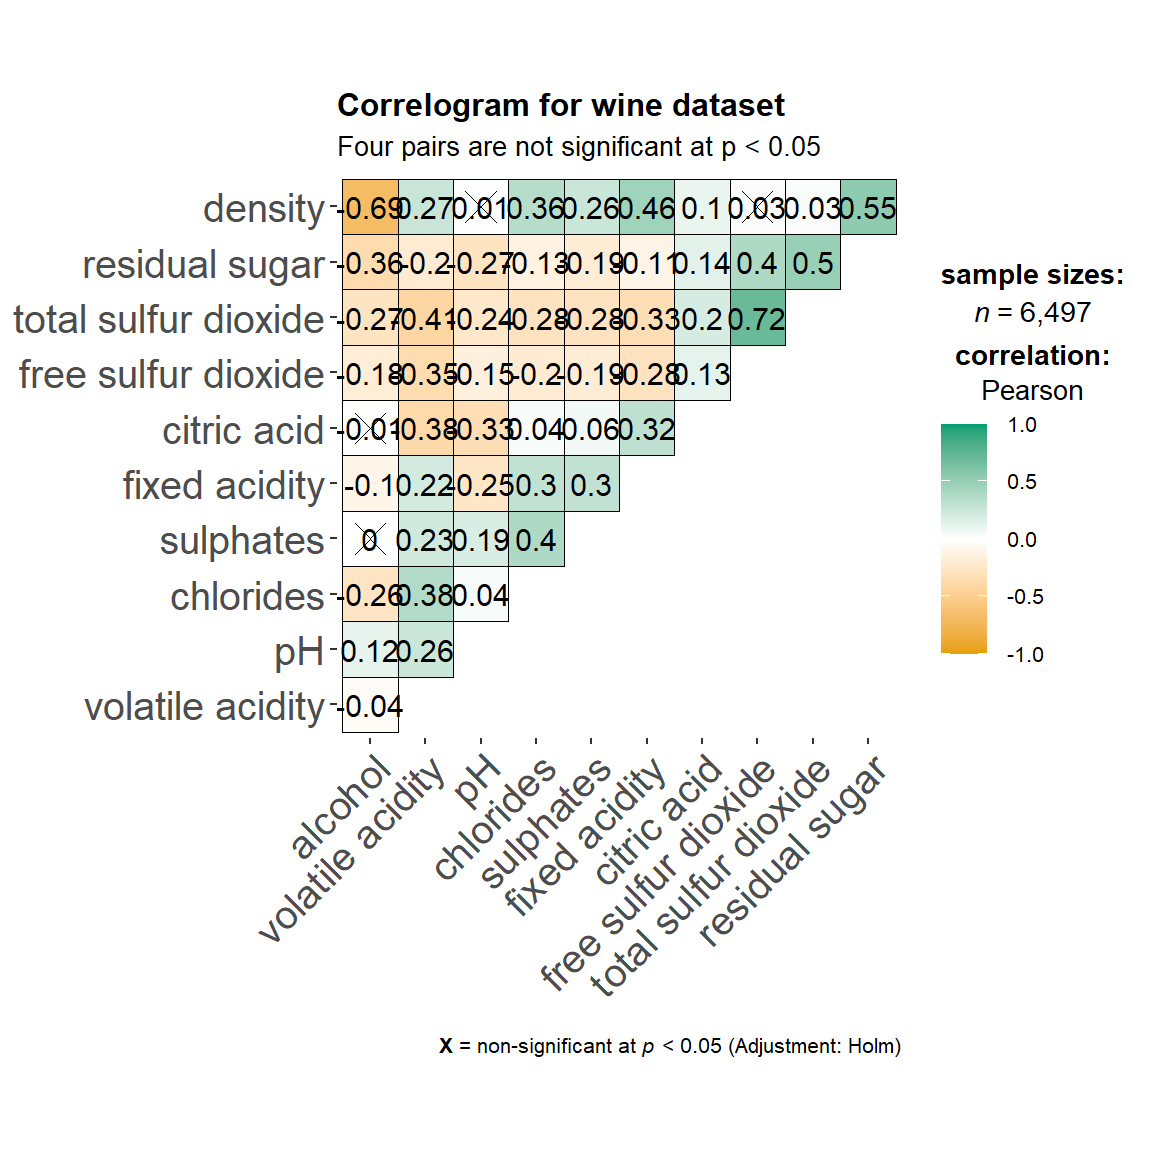
ggstatsplot::ggcorrmat(
  data = wine,
  cor.vars = 1:11,
  ggcorrplot.args = list(outline.color = "black",
                         hc.order = TRUE,
                         tl.cex = 15),  ## "X" size
  title = "Correlogram for wine dataset",
  subtitle = "Four pairs are not significant at p < 0.05"
)
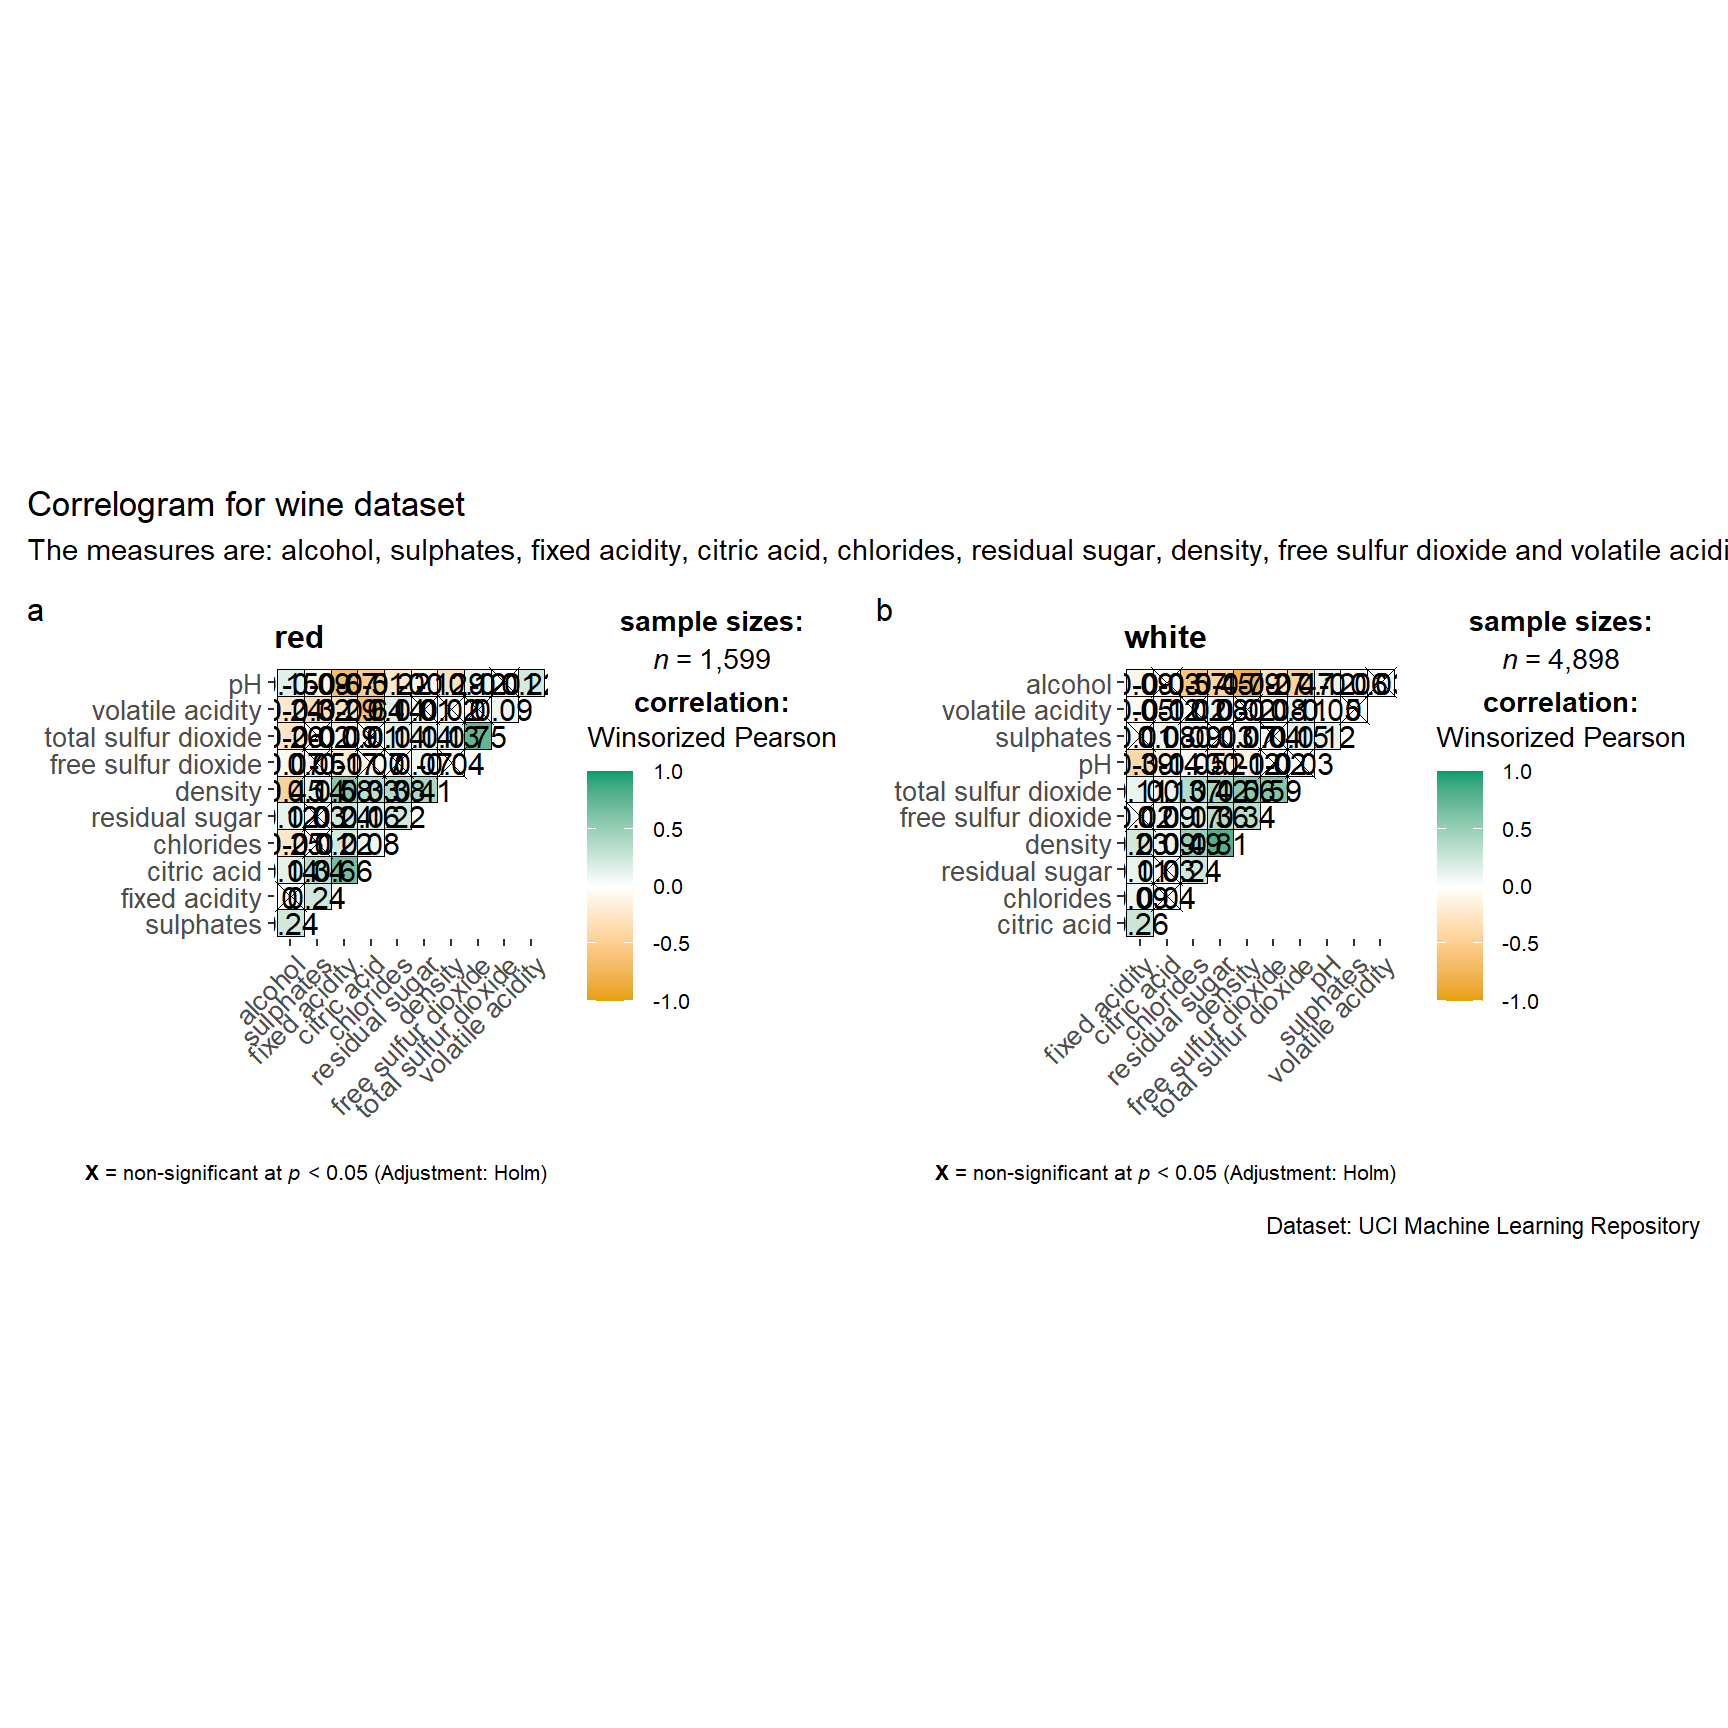
grouped_ggcorrmat(
  data = wine,
  cor.vars = 1:11,
  grouping.var = type,
  type = "robust",
  p.adjust.method = "holm",
  plotgrid.args = list(ncol = 2),
  ggcorrplot.args = list(outline.color = "black",
                         hc.order = TRUE,
                         tl.cex = 10),
  annotation.args = list(
    tag_levels = "a",
    title = "Correlogram for wine dataset",
    subtitle = "The measures are: alcohol, sulphates, fixed acidity, citric acid, chlorides, residual sugar, density, free sulfur dioxide and volatile acidity",
    caption = "Dataset: UCI Machine Learning Repository"
  )
)
wine.cor <- cor(wine[, 1:11])corrplot(wine.cor,
method = "ellipse",
type="lower",
diag = FALSE,
tl.col = "black")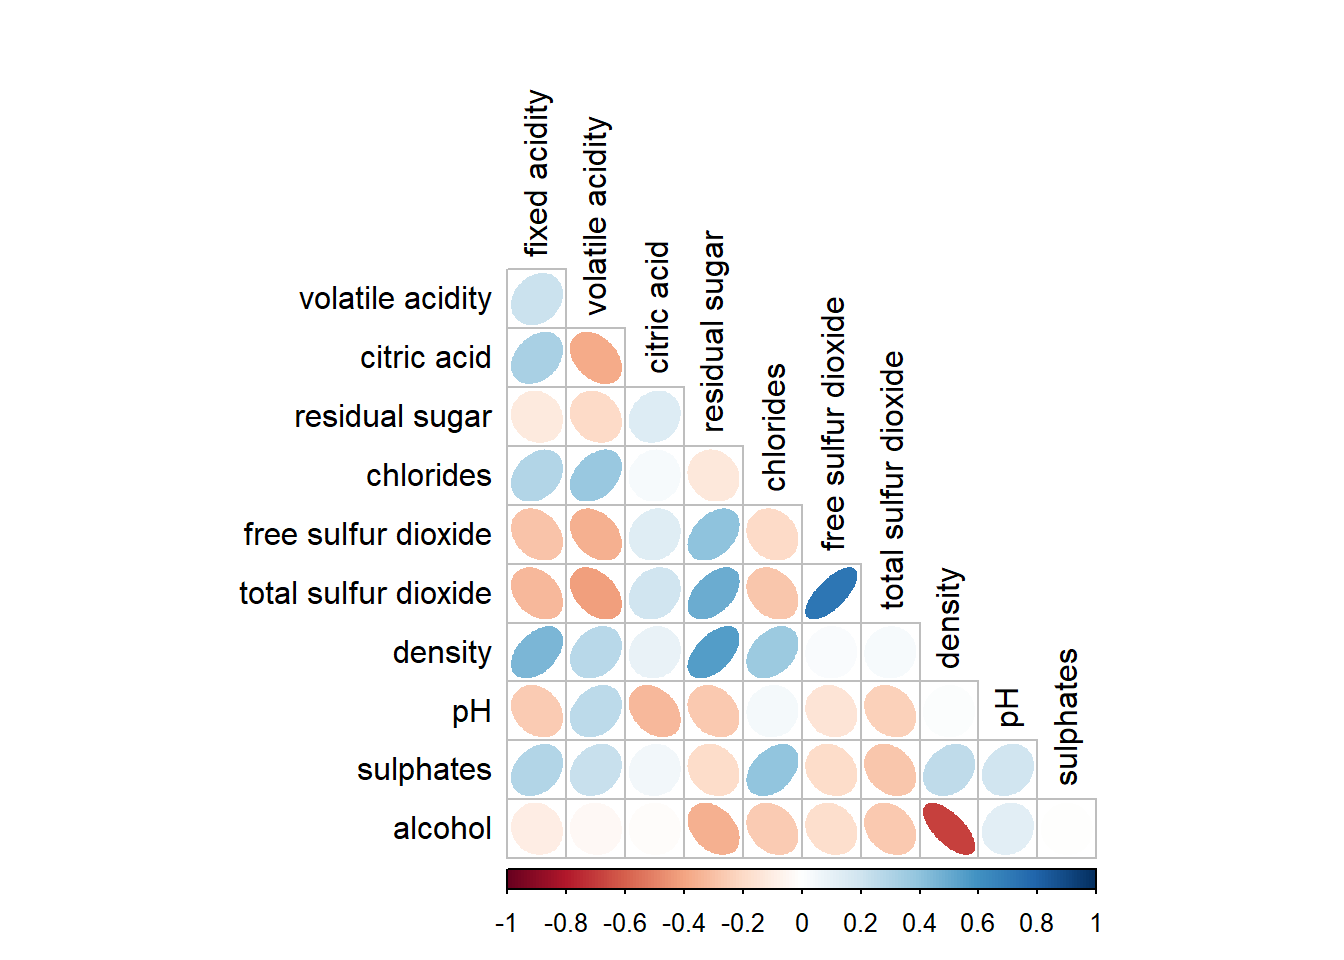
corrplot.mixed(wine.cor,
               lower = "ellipse",
               upper = "number",
               tl.pos = "lt",
               diag = "l",
               tl.col = "black")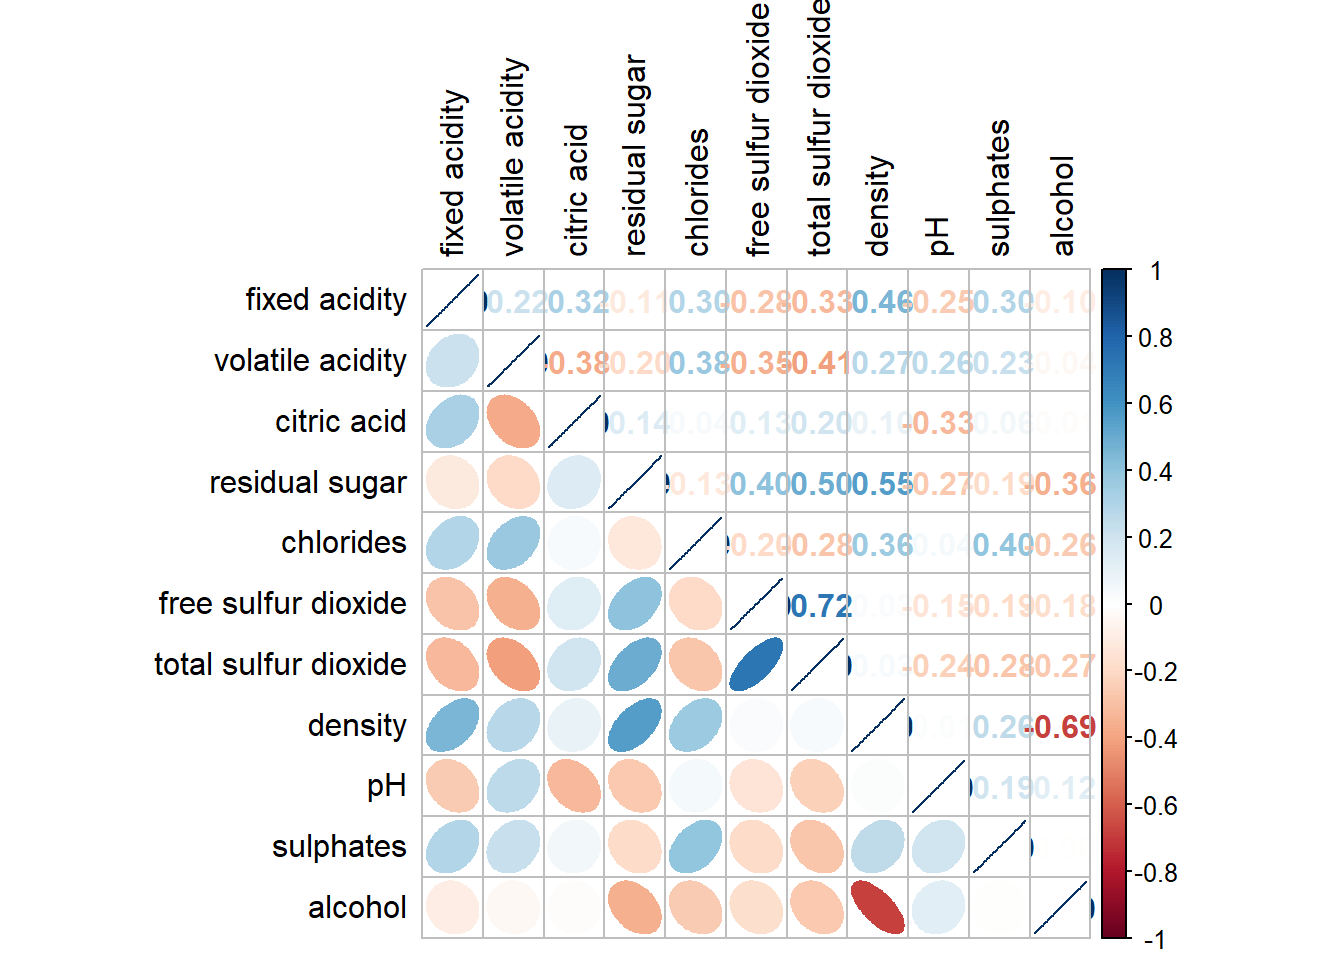
wine.sig = cor.mtest(wine.cor, conf.level= .95)corrplot(wine.cor,
method = "number",
type = "lower",
diag = FALSE,
tl.col = "black",
tl.srt = 45,
p.mat = wine.sig$p,
sig.level = .05)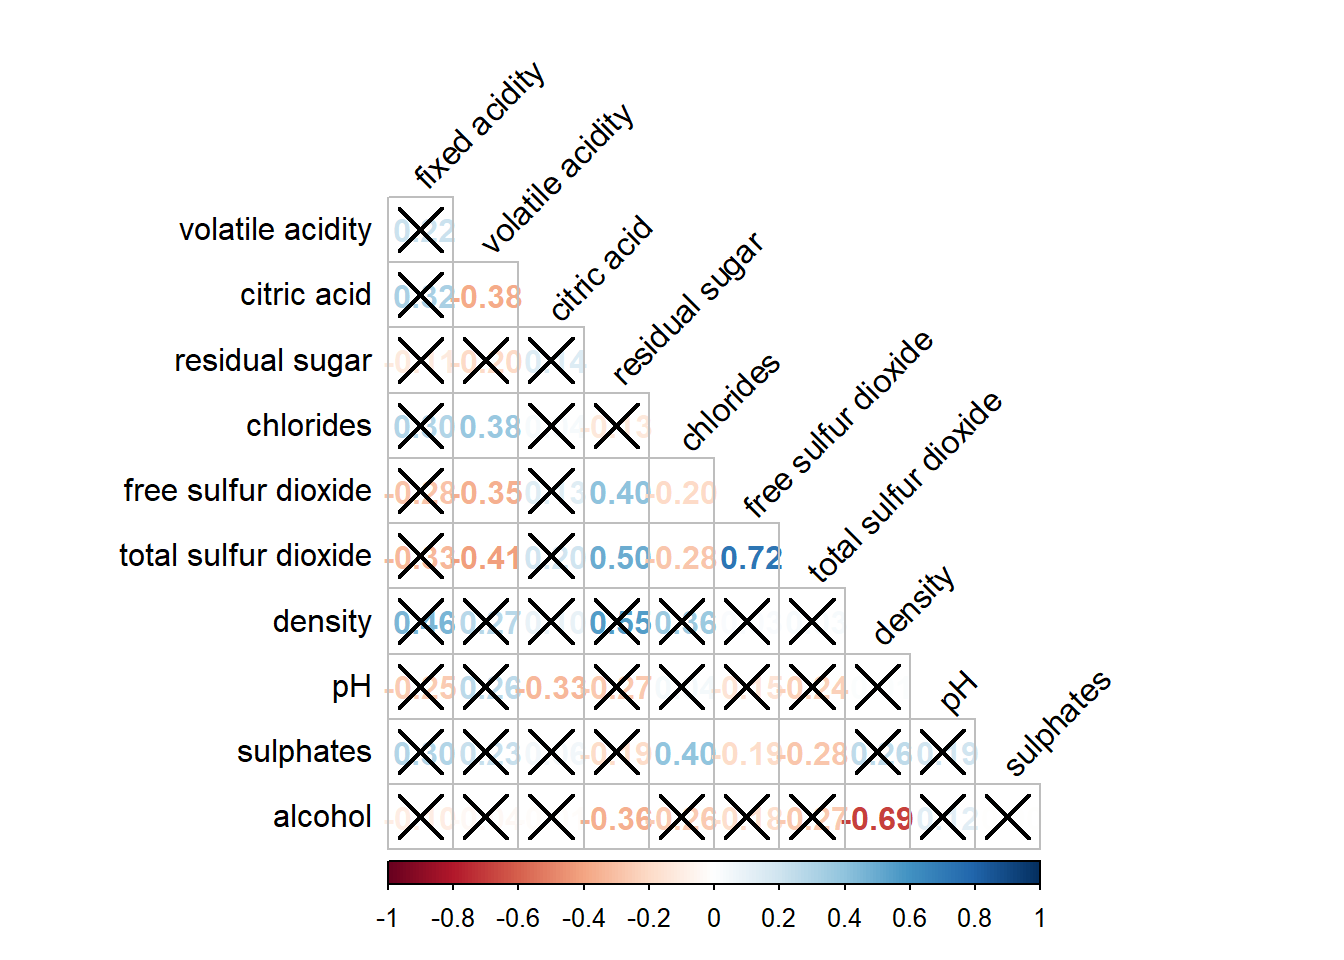
corrplot.mixed(wine.cor,
               lower = "ellipse",
               upper = "number",
               tl.pos = "lt",
               diag = "l",
               order="AOE",
               tl.col = "black")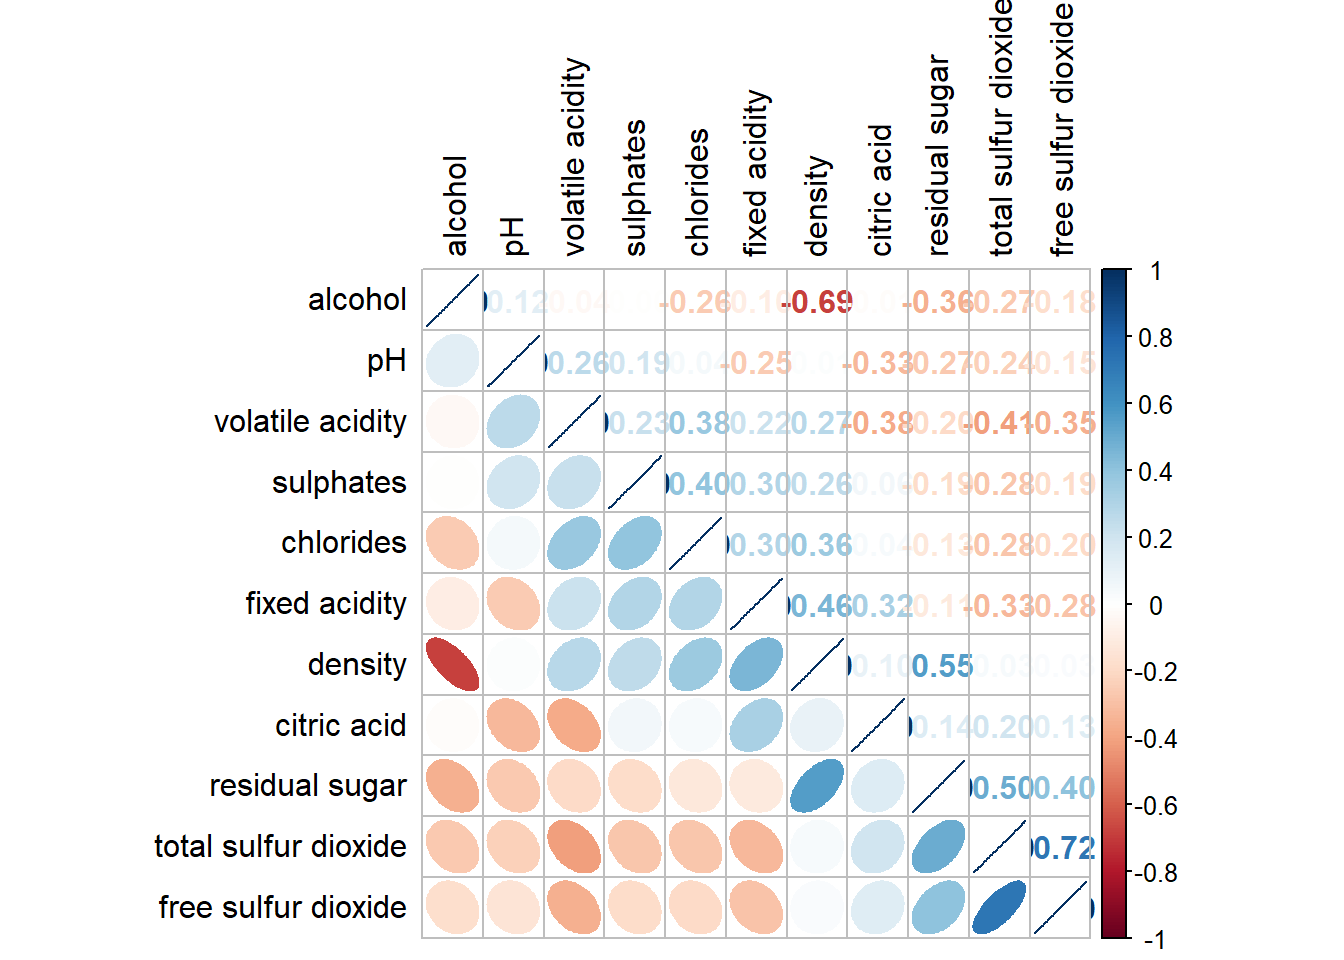
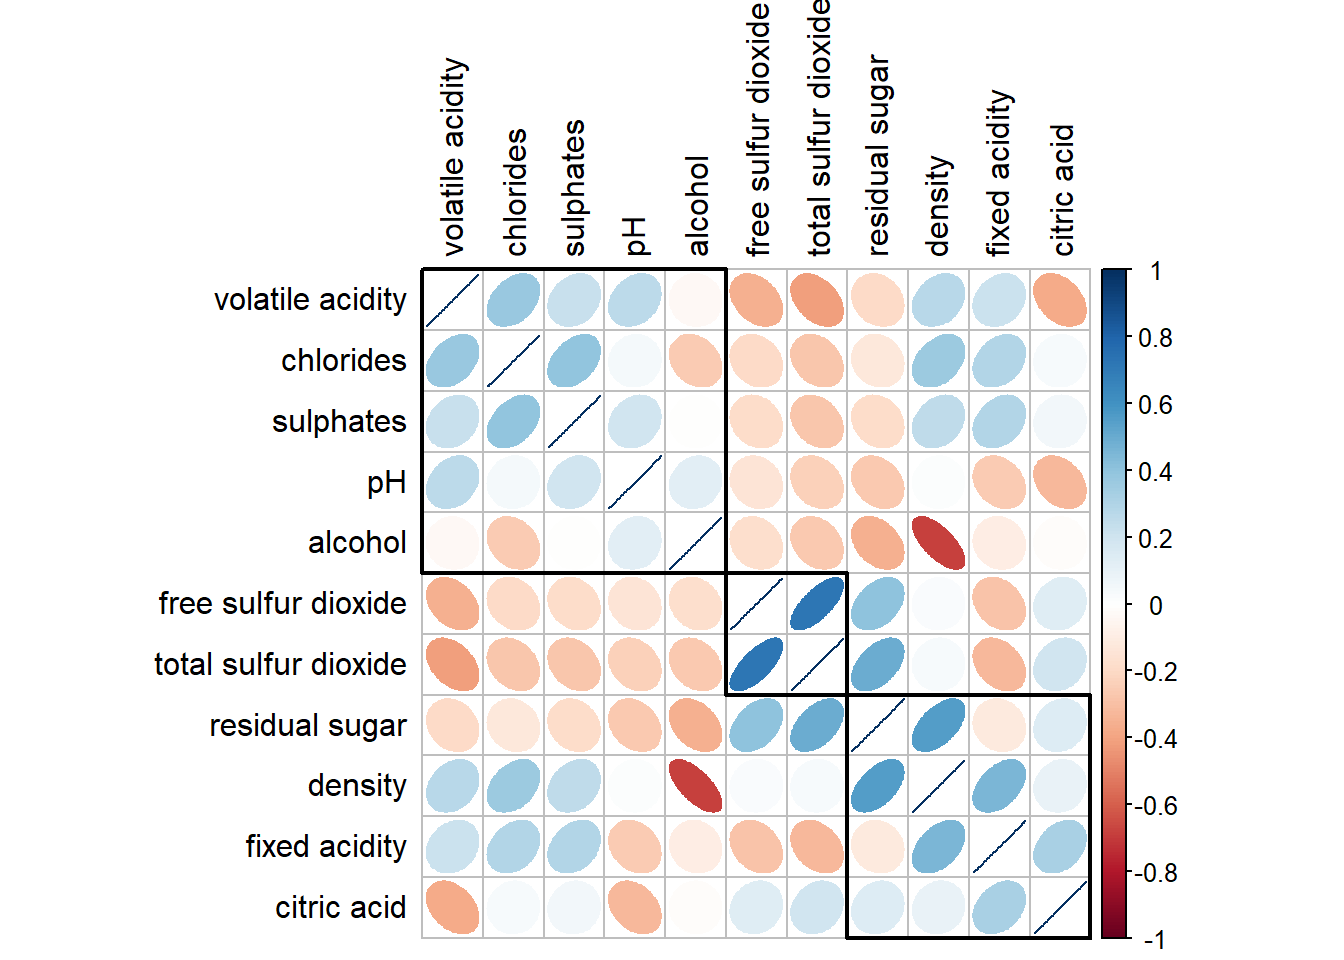
corrplot(wine.cor,
         method = "ellipse",
         tl.pos = "lt",
         tl.col = "black",
         order="hclust",
         hclust.method = "ward.D",
         addrect = 3)